 |
 |
 |
 |
 |
 |
||
 |
|||||||
Fresne-1 (U-Th)/He Case Study
|
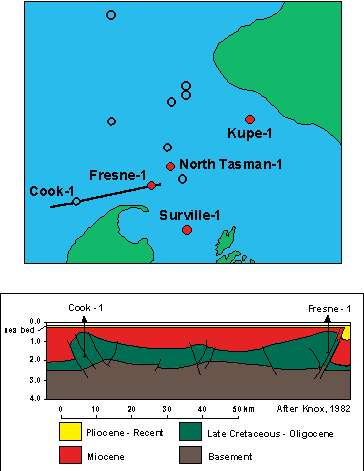
FIGURE 1 The Fresne-1 well is located in the Southern Taranaki Graben, between the North and South Islands of New Zealand. The well was drilled on one of several prominent Late Miocene inversion structures in the region. The stratigraphy of the section intersected in the well establishes tight constraints on the timing of inversion to between 15.5 and 2 Ma. The seismic section through the structure (after Knox, 1982) suggests between 2 and 3.5 km of section have been eroded from the structure during inversion. This well therefore provides an excellent test-bed for use of paleo-thermal techniques in determining the timing of cooling and amount of section eroded from the structure. AFTA data from the Fresne-1
well were first reported by Kamp and Green (1990). Since
that time, methods for extraction of thermal history information
from AFTA data have improved considerably. In particular,
the mono-compositional kinetic model (Laslett et al., 1987)
used at the time of that study has been superseded by a “multi-compositional
model” which incorporates the effects of variation in kinetic
response between apatites of different composition (chlorine
content), and provides more accurate definition of both the
magnitude and timing of maximum paleotemperatures from AFTA
data. Therefore, for this study the samples from the Fresne-1
originally analysed by Kamp and Green (1990) have been reanalysed
using latest methods, in which chlorine contents are measured
in every apatite grain analysed. Cl contents were measured
using an automated electron microprobe, which takes the apatite
grain locations from the computer-controlled microscope system
and directly locates each grain for analysis. |
|
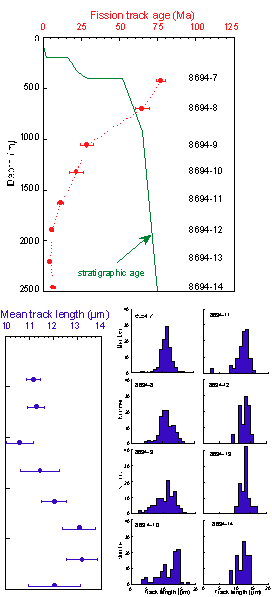
FIGURE 2 Figure 2 shows fission track ages plotted against depth (wrt kb) in the Fresne-1 well. Values for each sample are generally very similar to those reported by Kamp and Green (1990), showing a progressive reduction from around 80 Ma from the shallowest part of the Late Cretaceous to Early Tertiary coal measures section to values consistently around 5 to 10 Ma at depths greater than 1500 metres. This pattern of variation is characteristic of sections that have been hotter in the past, with the point marking the transition from rapidly decreasing ages to consistent values corresponding to the paleotemperature at which all samples are totally annealed prior to the onset of cooling. Mean track length and track length distributions show complementary behaviour. Shallow samples are dominated by shorter tracks, representing partially annealed tracks formed prior to the onset of cooling, with only a small proportion of longer tracks formed after cooling. With increasing depth, as fission track ages are progressively reduced, due to increasing maximum paleotemperatures, so is the mean length of the shorter component in each sample, representing an increasing degree of partial annealing of tracks formed prior to the onset of cooling. In the three deepest samples, all tracks were totally annealed prior to cooling, and only longer tracks, formed after cooling, are present. |
|
|
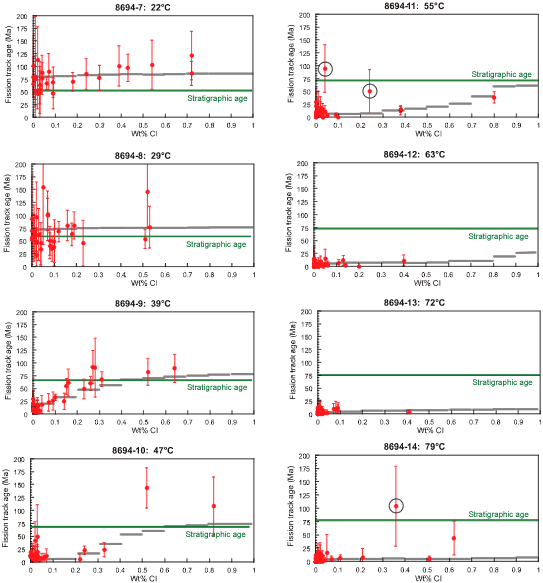
FIGURE 3 Figure 3 shows the variation of fission track ages of individual apatite grains with chlorine content within each sample. In samples 8694-7 and –8, in which the “central” or “pooled” fission track ages, characterising data from the entire collection of grains from each sample, are higher than the stratigraphic age of the samples, the individual grain ages show little or no variation with Cl content. But in sample 8694-9, in which the central fission track age is reduced to less than 50% of the stratigraphic age, the individual grain ages show a clear and consistent trend, with those grains with less than 0.1 wt% Cl having very young ages, and with ages increasing with Cl content such that in grains with greater than 0.3 wt% Cl, ages are indistinguishable from the stratigraphic age. Results from deeper samples show similar effects, but with the transition from very young ages to much older ages occurring at progressively higher Cl contents with increasing depth. In the deepest sample, 8694-14, all grains except for that with the highest Cl content between 0.6 and 0.7 wt% Cl give very young ages. These trends represent the progressive overprinting of tracks formed prior to the paleo-thermal maximum. In the deeper samples, the lower Cl-content grains were totally annealed prior to the onset of cooling (the fission track ages of these grains provides the best constraint on the time of cooling), with the range of Cl contents which were totally annealed prior to the onset of cooling increasing with depth, corresponding to progressively higher maximum paleotemperatures. Results from a small number
of grains, circled in Figure 2, do not fit within this general
pattern. These results highlight the fact that secondary
controls on annealing rates exist, in addition to the first-order
control exerted by Cl content. Data from these grains
have been removed prior to detailed thermal history interpretation. |
|
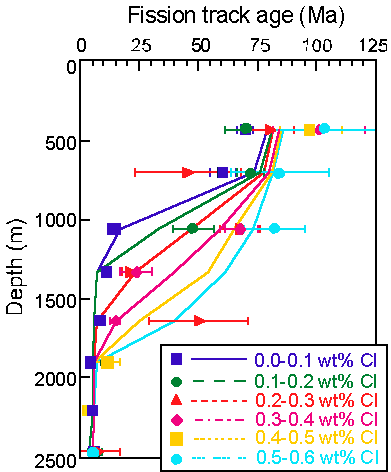
FIGURE 4 To further highlight the importance of compositional effects in these data, Figure 4 shows the fission track age of individual Cl content groups within each sample, plotted against depth. While the behaviour of the data in this plot are more erratic than those in Figure 2, due mainly to the small numbers of grains involved, the trend is clear with apatites with higher Cl contents achieving a particular degree of age reduction at progressively deeper levels, corresponding to higher maximum paleotemperatures. As a guide to visualising these effects, also shown in Figure 4 are the trends of fission track age with depth for separate compositional groups corresponding to the best-fit thermal history solution presented in later discussion. Predicted patterns of age vs Cl content within each sample corresponding to these solutions are also shown in Figure 3. Similar trends are also evident within the track length data in these samples, but these are not illustrated here. |
|
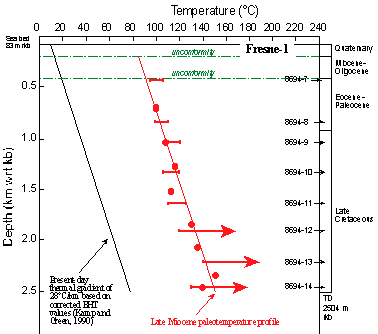
FIGURE 5 Thermal history information is extracted from AFTA data by comparing measured parameters (fission track age and track length distributions) with values predicted from a range of likely thermal history scenarios, systematically varying the magnitude and timing of the maximum palaeotemperature and using rigorous statistical procedures to define the range of conditions which are compatible with the measured data within 95% confidence limits. VR data are from Lowery (1988) and have been converted to maximum paleotemperatures using the kinetics of Burnham and Sweeney (1989), using the thermal history framework defined by AFTA. Note that we do not attempt to constrain the whole thermal history of each AFTA sample. Instead we focus on those aspects of the thermal history that control the development of the AFTA parameters – specifically the maximum paleotemperature of each sample, and the time at which cooling from that paleotemperature began. Note also that because AFTA and VR data preserve no information on the approach to the paleo-thermal maximum, it is necessary to assume a value of heating rate (10°C/Ma for this study). In addition, because the main cooling phase began quite recently, the number of tracks formed after cooling is small, and therefore the AFTA data provide very little control on the cooling history, and as a “first pass” we have assumed linear cooling at 10°C/Ma. Figure 5 shows paleotemperature constraints from AFTA and VR in the Fresne-1 well, plotted against depth (rkb). This plot illustrates the high degree of consistency between the maximum paleotemperatures derived from AFTA and VR. The combined paleotemperature constraints define a linear profile, with a slope which is similar to that of the present-day temperature profile, suggesting a most likely explanation of heating due solely to deeper burial. Combining results from all eight
samples, the best estimate from AFTA of the time at which cooling
began is between 9 and 8 Ma. |
|
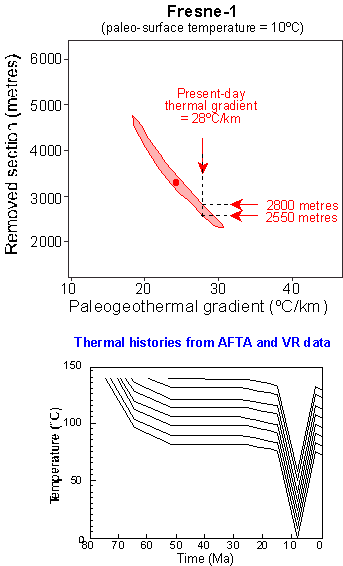
FIGURE 6 The slope of a line fitted to the palaeotemperature profile in Figure 5 provides an estimate of the palaeogeothermal gradient at the paleo-thermal maximum. Extrapolating the fitted linear profile to an assumed palaeo-surface temperature then provides an estimate of the amount of section removed by erosion. Statistical techniques (using likelihood theory, due to the ranges of paleotemperature allowed by the AFTA data) allow definition of the range of each parameter allowed by the palaeotemperature constraints within 95% confidence limits (Bray et al., 1992). Figure 6a shows the range of allowed values of palaeogeothermal gradients and removed section which are consistent with the palaeotemperature constraints from AFTA and VR in the Fresne-1 well. The plot also highlights the correlation between allowed values of the two parameters, such that higher palaeogeothermal gradients require correspondingly lower values of removed section, and vice versa. The maximum likelihood palaeogeothermal gradient is 24.5°C with upper and lower 95% confidence limits of 30 and 19°C/km, respectively. The present-day thermal gradient of 28°C/km falls well within this trend, and given the relatively late timing for the main cooling phase, it seems most likely that the paleo-thermal gradient at the time at which cooling began was close to this value. A paleogeothermal gradient of 28°C/km corresponds to between 2550 and 2800 metres of removed section, as shown. Thus, we adopt the mid-point value of 2675 metres as the best estimate of the amount of section removed on the Late Miocene-Pliocene unconformity in the Fresne-1 well. This is highly consistent with independent estimates from reconstructing seismic sections (Figure 1). Taking values of 28°C/km for
the paleogeothermal gradient and 2675 metres of section removed,
reconstructed thermal histories for units intersected in the
Fresne-1 well are shown in Figure 6b. |
|
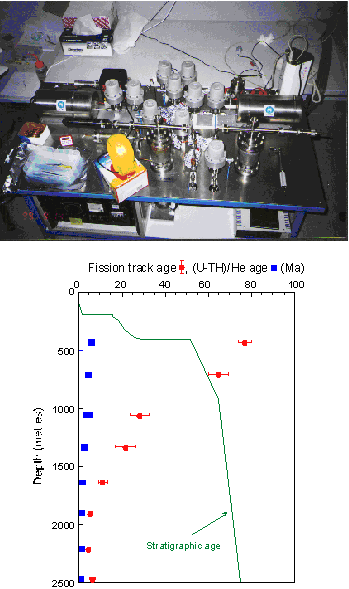
FIGURE 7 Figure 7a (upper) shows the equipment used to measure (U-Th)/He ages (courtesy of CSIRO Division of Petroleum Resources, Sydney). The CSIRO He extraction and analysis facility comprises an all-metal He extraction and gas-handling line connected to a dedicated on-line Balzers Prisma 200 quadrupole mass spectrometer. Gas extraction is performed by using either of the 2 identical single vacuum resistance furnaces, where samples are heated to ~900°C for ~15 minutes. The line and furnace are evacuated to ~10-8 mbar via ion, turbo and backing pumps. Active gases, particularly hydrogen, are removed using SAES getters. The analysis procedure is operated by LabVIEW automation software supplied by Prof. Ken Farley, Caltech. Figure 7b (lower) shows (U-Th)/He ages in the eight samples from Fresne-1, plotted against depth. Fission track ages, and the variation of stratigraphic age with depth, are also shown, for comparison. In the shallower samples, the He ages are much younger than fission track ages in the same sample, while the difference is much less pronounced in the deeper samples. Helium ages in the shallower samples are similar to the fission track ages in the deeper samples. These He ages are clearly responding to cooling at around the same time as recorded in the fission track ages. But because of the effects of He loss at present-day temperatures, these (U-Th)/He ages cannot be interpreted directly as dating specific cooling events. Instead, the cumulative effects of the thermal histories of the samples within the sedimentary basin context must be taken into account. |
|
FIGURE 8 Figure 8a shows the “first pass” thermal history solutions derived from the AFTA and VR data, from Figure 6b. Note that the heating and cooling rates of 10°C/Ma assumed in interpreting the data appear to be realistic, based on this reconstruction. The youngest unit below the unconformity is dated at 15.5 Ma (Kamp and Green, 1990), the total amount of heating involved is ~75°C, and cooling began at around 8.5 Ma. These combine to suggest a heating rate very close to 10°C/Ma. Similarly, with a depositional age of around 2 Ma for the youngest sediment above the unconformity, cooling by 75°C in 6 Ma again suggests an overall cooling rate close to 10°C/Ma. Thus, this reconstruction for units intersected in the Fresne-1 well provides a self-consistent description of the data discussed so far. Figure 8b shows the (U-Th)/He
ages measured in apatites from the eight AFTA samples in the
Fresne-1 well (from Figure 7b). As a starting point to
more fully understanding these Helium age results, we have modelled
the values expected in each sample on the basis of the thermal
history framework obtained from the AFTA and VR data (Figure
8a). This has been carried out using software provided
by Prof. Ken Farley of Caltech, based on the systematics presented
in Farley (2000) and references therein. Predicted ages
are shown for four grain radii (since grain size affects diffusion
rates, larger grains retain more He than smaller grains, for
a given thermal history). The mean radii in the samples
analysed from Fresne-1 are generally around 50 µm, and
this trend in Figure 8b is the most appropriate for direct comparison
with the measured ages. In general, the predicted and
measured ages in Figure 8b show a fair degree of agreement,
particularly at the shallowest and deepest extremes of the depth
range, while predicted values from the middle of the sampled
interval are higher than measured values. |
|
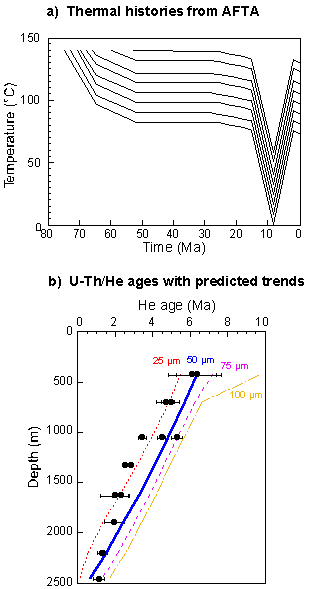
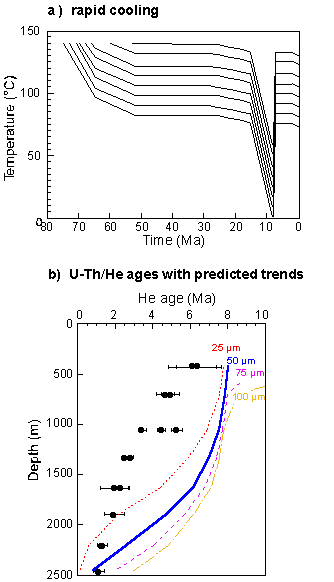
FIGURE 9 Given that the predictions are based purely on diffusion systematics derived from extrapolation of results from laboratory conditions, it is not, at present, clear whether the slight mis-match between measured and predicted ages arises because the real thermal histories are somewhat different from those in Figure 8a, or because of slight errors in the diffusion systematics. Similar comparisons of measured (U-Th)/He ages with predicted values in samples from wells located in the Otway Basin of S.E. Australia by House et al. (1999) suggested that the diffusion systematics could be extrapolated to geological conditions with confidence, and on this basis, we proceed to consider how the thermal histories in Figure 8a could be refined to give a better fit to the measured ages. Figure 9a shows an alternative thermal history style, characterised by rapid cooling from the maximum at 8.5 Ma, with all cooling achieved within 1 Ma. Figure 9b shows a comparison of (U-Th)/He ages predicted from these histories with the measured values. In this case, rapid cooling predicts much older ages than in Figure 8b, and a much worse fit to the measured ages. Thus, this scenario can be eliminated. |
|
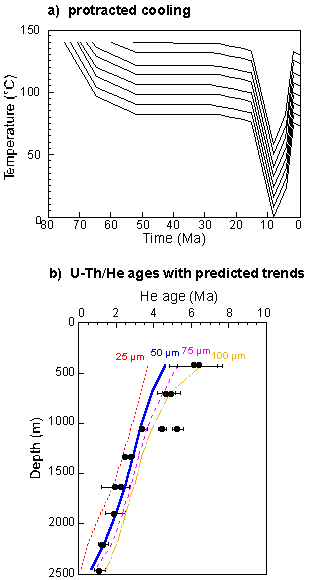
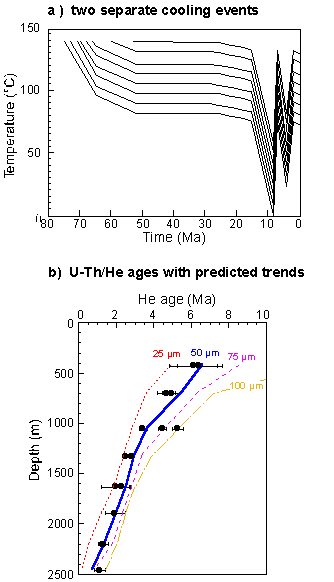
FIGURE 10 As a further alternative, Figure 10a illustrates a thermal history scenario involving protracted cooling, where 50°C of the total 75° cooling occurs between 4 and 2 Ma. The predicted age trends in Figure 10b now show an improved match to the measured ages, especially at depths greater than ~1000 metres, although the predicted ages in the two shallowest samples are younger than the measured values. This suggests that these samples perhaps cooled earlier than the deeper samples, suggesting a thermal history scenario involving two discrete cooling episodes, as illustrated in Figure 11. |
|
FIGURE 11 Figure 11a illustrates a thermal history scenario which is based on that illustrated in Figure 10, but now involves two discrete cooling episodes, with an initial phase at 8.5 Ma and a later cooling phase beginning at 4 Ma (again with 50°C of cooling since 4 Ma). Figure 11b shows the age trends predicted from this scenario, and in this case the agreement between measured and predicted ages is extremely good across the whole depth range. While it remains, to some extent, uncertain whether this treatment represents over-reliance on the extrapolation of laboratory diffusion systematics, and more tests are required in controlled geological conditions, this procedure certainly illustrates the potential of the (U-Th)/He technique to complement AFTA and VR data in sedimentary basins to provide further definition of thermal history styles, particularly in terms of refining the most recent, low temperature, phase of the history. |
Acknowledgements We are grateful to Ken Farley of Caltech for providing the simulation software used to predict (U-Th/He ages for this study. We also acknowledge the efforts of our co-workers on this project, Dr. Peter Crowhurst of CSIRO Division of Petroleum Resources, Sydney, and Prof. Peter Kamp, The University of Waikato, Hamilton, New Zealand. AFTA® is the registered trademark of Geotrack International. |
References
|
