 |
 |
 |
 |
 |
 |
||
 |
|||||||
The influence of chlorine content on fission track annealing kinetics in apatite
Natural apatites essentially have the composition:
Ca5(PO4)3(F,OH,Cl)
with fluorine, hydroxyl and chlorine ions forming a substitution series. Most common detrital and accessory apatites are predominantly fluor-apatites, but some may contain appreciable amounts of chlorine.
| Apatite
compositions: ternary plot - 4172 grains |
Typical
apatite Cl distributions |
The amount of chlorine in the apatite lattice exerts a subtle yet critical compositional control on the degree of annealing, with apatites richer in fluorine being more easily annealed than those richer in chlorine.
As a result, individual apatite grains within a single sample that has been heated to the temperature range where the differential effect is large will show a spread in the degree of annealing (i.e reduction in fission track age and track length). This effect becomes most pronounced in samples which have reached peak paleo-temperatures in the range 90 - 110°C. Below ~80°C, the difference in annealing sensitivity is less marked, and compositional effects are less important.
|
|
|
The influence of chlorine content is also readily observable in the
laboratory.
|
|
Since those early measurements, a consistent body of evidence has built up to emphasise the importance of Cl content. Some typical examples are shown below:
Taranaki Basin well Fresne-1 (from Crowhurst et al., 2002):
more details...
These plots illustrate the relationship between fission track age and wt% Cl in individual grains of apatite from eight samples downhole in the Fresne-1 well. With increasing depth and present-day temperature (shown for each plot), the degree of annealing prior to cooling from the maximum post-depositional paleotemperature increases, and apatites with progressively higher Cl contents were totally annealed. The grey lines represent the predicted trend from the best-fit history. Note that three grains, out of over 160 represented in these plots, do not fit the general pattern. These probably represent second order influences on annealing, which are clearly only of minor importance. Presentation of data in this way allows such spurious data (e.g. contamination) to be easily identified and removed.
Another way of looking at these data is to plot the pooled age of each compositional group against depth:
This illustrates the typical degree of differential annealing behaviour introduced by chlorine. The difference in the depths at which apatites containing 0.0-0.1 and those containing 0.5-0.6 wt% Cl are totally annealed prior to the onset of cooling is almost 1 km, equivalent to a temperature difference of about 25°C in this well.
Southern North Sea well 47/25-1:
In this well, fission track ages in individual apatite grains show distinct trends of age vs wt% Cl. In the shallower sample (GC290-5), only apatites containing less than 0.1 wt% Cl were totally annealed prior to cooling, but in the deeper sample (GC290-6), the consistent ages over a range of Cl contents from 0 to 0.5 wt% Cl show that all these apatites were totally annealed prior to the onset of cooling. This trend helps to define the time at which the sample cooled from the maximum paleotemperature, around 60 Ma (note that the measured ages are less than this because of further annealing after cooling began).
In samples which are now at their maximum post-depositional paleotemperatures, the expected trends of AFTA parameters with Cl are fairly simple:
Patterns
of within-sample age variation: |
Patterns
of within-sample length variation: |
Here are some data from a sample that corresponds to somewhere between the orange and magenta trends in the above Figure:
Jurassic
sandstone, North Sea, 103°C |
 |
In samples which have been hotter in the past, the trends within the age data are also quite simple, but trends within the length data are much more complex, reflecting the relative contributions of short tracks formed prior to the thermal maximum, and long tracks formed after the onset of cooling:
| Patterns
of within-sample age variation: Hotter in the past  |
Patterns
of within-sample length variation: Hotter in the past  |
| Triassic sandstone, Northern England, 100°C at ~60Ma | |
 |
 |
In samples that have been hotter in the past, it’s easier to look at the track length distributions within each compositional division:
The red histograms represent the measured track length data, the blue histograms represent the predictions of the best-fit thermal history, and the overlap between the two is shown as magenta. Pure fluorapatites (top left) were near-totally annealed prior to the onset of cooling, and the track length distribution is unimodal, dominated by a peak of long lengths around 14 microns. In contrast, the track length distribution in apatites containing 0.3 to 0.4 wt% Cl (top right) is bimodal, with a prominent peak of short tracks (formed up to the paleo-thermal maximum) as well as a longer peak (tracks formed after the onset of cooling), in roughly equal proportions. As the chlorine content increases, the length of the shorter peak becomes increasingly longer, such that in apatites containing 0.7 to 0.8 wt% Cl, the two components cannot be resolved and the track length distribution is unimodal. This reflects the decreasing degree of annealing of tracks formed up to the paleo-thermal maximum as Cl content increases, as also reflected in the trend of age reduction vs Cl shown in an earlier Figure.
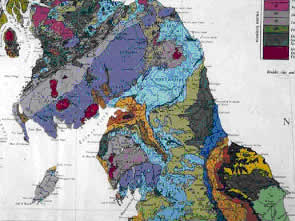
The data from the Triassic sandstone sample shown above calls to mind the AFTA data from the Lake District, published by Green (1986):
 |
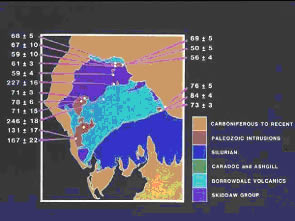 |
Samples show a considerable spread in age within a relatively small area, mainly reflecting variation in Early Tertiary paleotemperatures across the region. The variation in age is due to different degrees of annealing of tracks formed prior to the onset of Early Tertiary cooling, and correlates with the variation in mean track length and the shape of the track length distribution (below):
 |
 |
The right hand Figure illustrates the interpretation of the trend in the measured parameters (left), showing how the shape of the track length distribution changes systematically, reflecting the mixture two components, a long population of tracks formed after the onset of Early Tertiary cooling, and a shorter component representing tracks formed prior to the onset of cooling, with the length of the shorter component decreasing with the reduction in fission track age.
Compare these Figures, based on a suite of outcrop samples, to the variation within the single sandstone sample shown earlier, introduced by the influence of Cl content on annealing rates. The full spectrum of the effects seen in the outcrop suite is present within a single sample!